

How to Series
How to Import Data into nuVerve
Importing your data is the first step toward analyzing, visualizing, and extracting insights from it in nuVerve. Data is organized into datasets within your projects, giving you a structured environment where source data can be prepared and used across your analysis workflows.
In this guide, you’ll learn how to create a dataset, import an Excel file into nuVerve, and prepare your data for labeling and analysis.
Understanding Datasets and Data Sources in nuVerve
In nuVerve, your data is organized into datasets within a project. A dataset contains the data sources you want to work with, and you can have more than one source within a dataset. This allows related data to be organized according to the needs of your project and analysis.
Once your data has been imported, you can create labels that make the information available for use in your analysis flows.
How to Create a Dataset in nuVerve
Start by opening the project where you want to work with your data.
Step 1. Add a new dataset
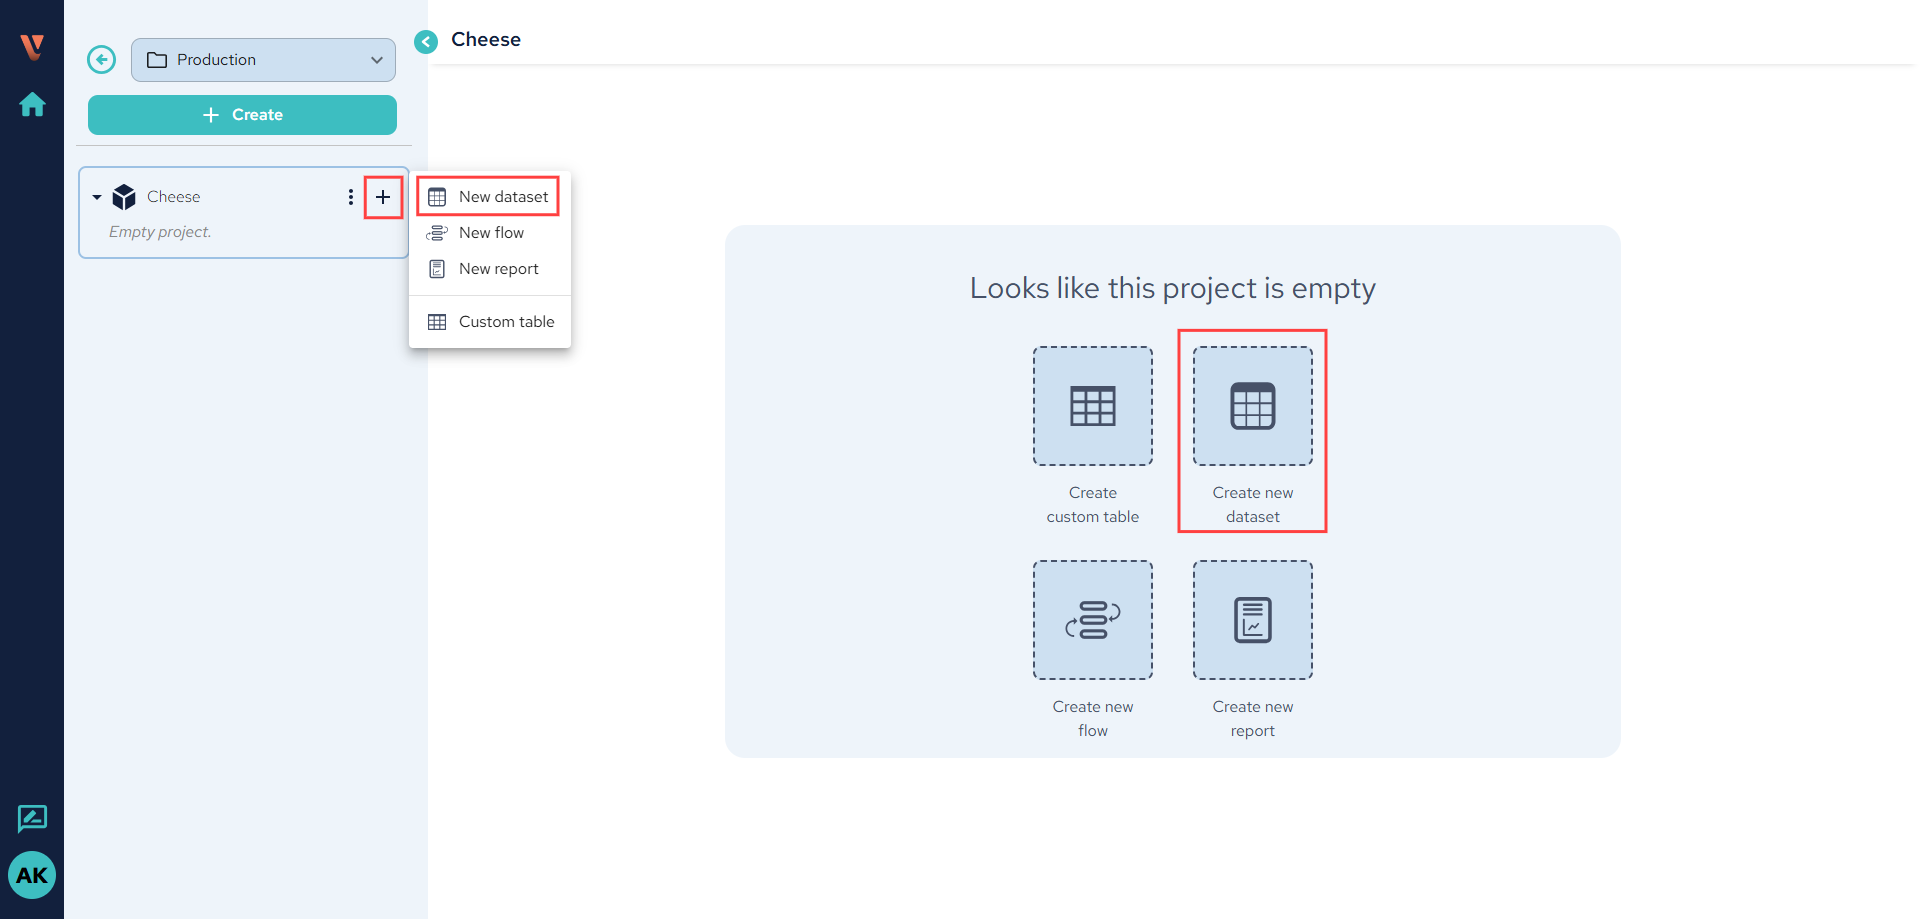
At the project level, click the + button to add a new element and select Dataset. If you’re working in a new project without an existing dataset, you can also use the available button to create your first dataset directly.
Step 2. Name your dataset
Enter a name for your dataset and press Enter to save it. Choose a name that makes the dataset easy to identify, especially if your project will contain multiple datasets or data sources.
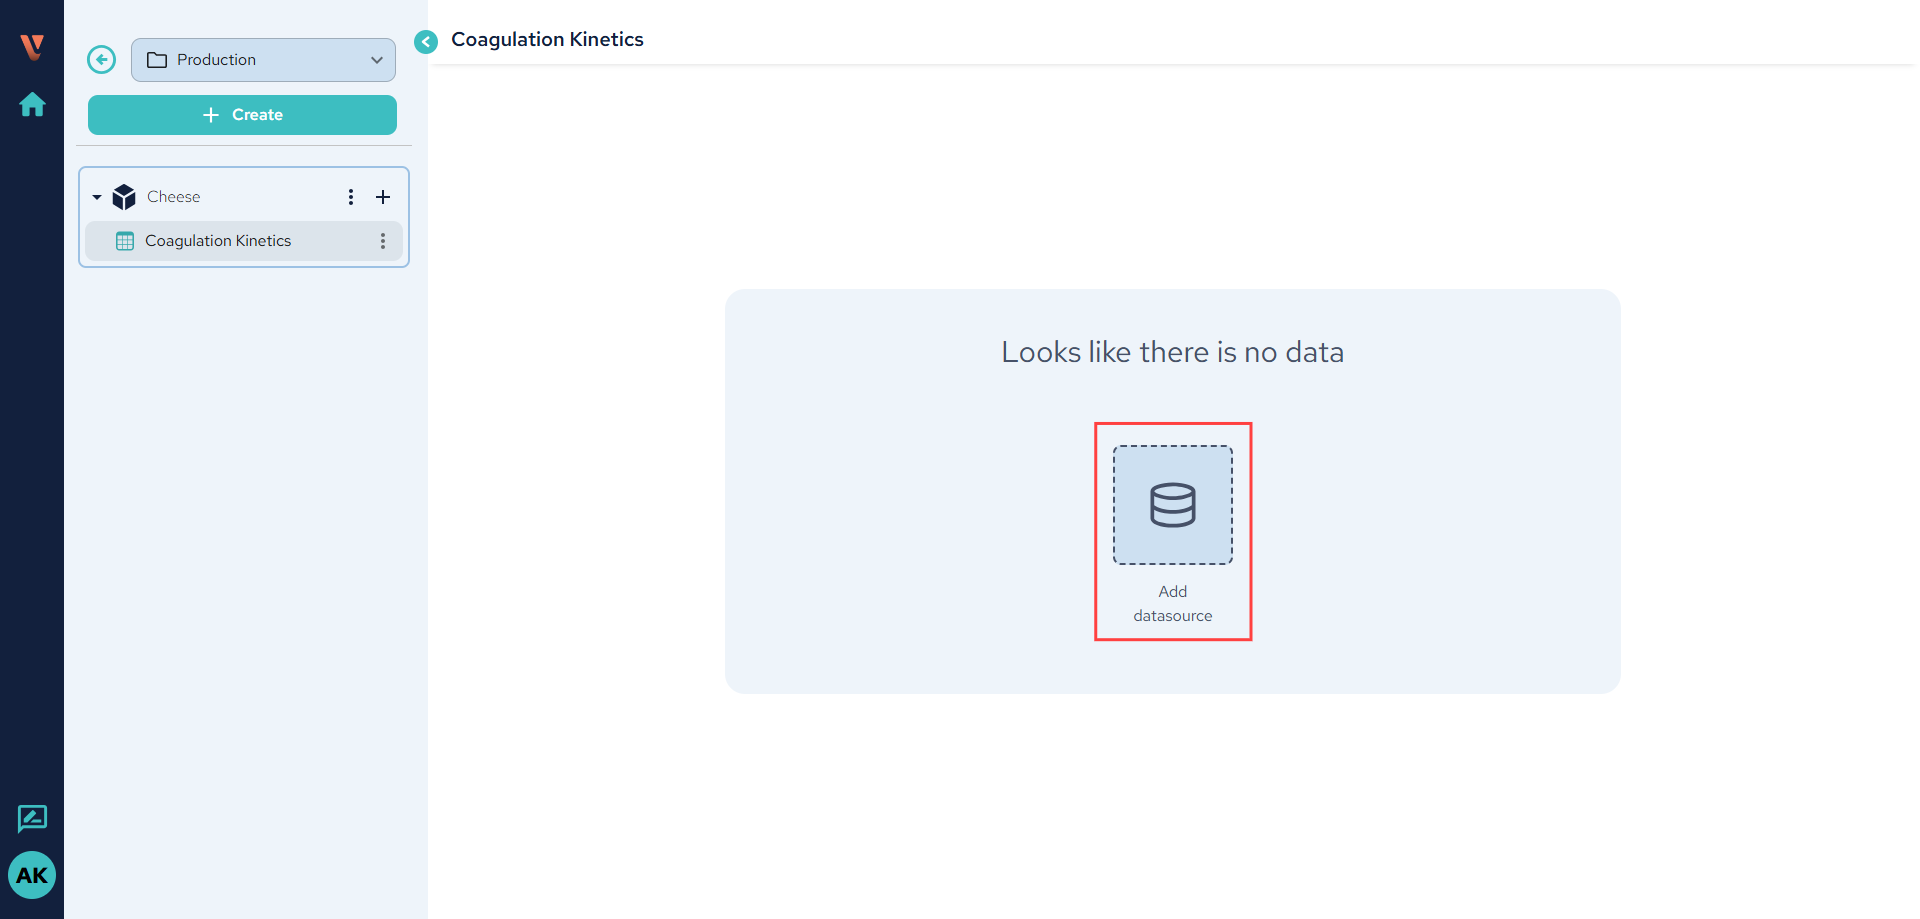
Your dataset is now ready for you to add a data source.
How to Import an Excel File into nuVerve
Step 1. Add a data source
From your dataset, select the option to add a new data source.
Step 2. Add an Excel data source
Select Excel as your data source.

Step 3. Upload your Excel file
You can add the file in two ways:
- Click the upload area to open your computer’s file explorer and select the file.
- Drag and drop the file directly into the upload area.
Once the upload is complete, the file will appear as a source within your dataset.

Step 4. Save the data source
Click Save to save the uploaded data in nuVerve. Your Excel file is now part of your dataset and ready for the next step: labeling the data you want to use in your analyses.
How Should Your Excel Data Be Structured for Analysis?
For a standard Excel file, data can be organized with headers in the first row and the corresponding values arranged in columns. For example, columns might represent variables such as dates, batch or sample identifiers, process measurements, product characteristics, or other numerical and text variables.

With this structure, you can use Auto Labeling to automatically create labels based on the columns in your file.

If your Excel file has a different structure, nuVerve also provides Custom Labeling, allowing you to manually identify the relevant label names and their corresponding data ranges. For a detailed walkthrough of this workflow, see How to Import and Label Unstructured Data in nuVerve.
What Happens After You Import Your Data into nuVerve?
Once your file is saved, the next step is to create the labels you’ll use to work with your data. Labels correspond to the information available in your source and can have different data types, including Text, Numeric, and Date.
For a structured Excel file, Auto Labeling can automatically identify the columns and create the corresponding labels. Before saving your labels, you can review them and adjust their data types if necessary.
nuVerve displays a preview of the first 50 rows during this step. This is only a preview of the source and does not mean that only those rows were imported. Once your labels are saved, they become available for use in your analysis flows.
Can You Add Multiple Data Sources to a Dataset?
Yes. A dataset can contain multiple data sources. When adding additional data, you can choose whether it makes more sense to add another source to an existing dataset or create a separate dataset within the project.
This gives you flexibility to organize your data according to the structure and objectives of your analysis.
From Data Import to Analysis
Importing your data establishes the foundation for your analysis in nuVerve. Once the source is added, the workflow progresses from:
Source File → Dataset → Labels → Analysis Flow
After the data is imported and labeled, you can work with those labels in your flows to create charts, calculate statistics, build tables, apply filters, and perform other analyses. This allows you to select the relevant information for each analysis rather than working directly with the source spreadsheet every time you want to investigate your data.
Next Step: Label and Structure Your Data
Now that your data is available in nuVerve, the next step is to make sure it is properly labeled and structured for analysis. Learn how Auto Labeling works, review your labels and data types, and prepare your dataset for use in analysis flows.
Continue to: How to Label and Structure Your Data in nuVerve →
See How nuVerve Works with Your Data
Discover how nuVerve can help your team bring data into a no-code environment and build reusable analysis workflows around the information that matters to your work.