Case study
How does nuVerve compare to Excel and Word for Dairy Production Data Analysis?

Introduction
Managing and reporting on cheese production data — such as milk composition, cheese yield, and ingredient costs — is essential for quality, compliance, and profitability. However, using traditional tools like Excel and Word makes this process time-consuming, error-prone, and hard to update.
In this case study, we compare the performance of nuVerve, our no-code collaborative analytics platform, to the classic approach using Excel and Word.
The goal: to replicate a real-world cheese production analysis and reporting workflow in both environments to measure the difference in efficiency and cost savings.

Methodology
We used the same datasets representing production data from a cheese plant producing cheddar, first for the year 2023, then with additional data for 2024. The analysis aimed to produce key operational indicators, financial metrics, and a report suitable for collaboration.
The dataset used in both scenarios is an Excel file containing detailed information on individual cheese batches. Each row corresponds to a single batch, and the columns capture a wide range of variables, including:
- Milk composition (e.g., %Fat, %Protein, %Lactose, %Solids)
- Cheese composition (e.g., %Moisture, %Fat, %Casein, %Dry Matter)
Production data (e.g., volume of milk, rennet and calcium quantities, cheesemaker) - Yield metrics (actual yield, theoretical yield, yield adjusted to moisture, and their differences)
- Economic indicators (e.g., cost of ingredients, cheese value per kg, cost per volume of milk)
The data comes from a single type of cheese, with batch-level granularity allowing precise analysis of yield, composition, and associated costs.

& data manipulation

sheets and columns
The objective was to produce the following:
Analysis
- Milk composition graphs: to plot milk fat, protein, solids, protein-to-fat ratio over time. Each graph contains 2 series: data for raw milk and for standardized vat milk.
- Milk composition statistics: to calculate the average value of fat, protein, solids, protein-to-fat ratio for both raw and vat milk.
- Cheese composition graphs: to plot cheese fat, solids, moisture over time, and average cheese moisture per cheesemaker.
- Financial indicators graphs: to plot as a function of time the cost of ingredients to produce 1 kg of cheese, cost of ingredients per liter of milk, cheese yield over time, and cheese yield vs milk vat protein content.
- Table gathering essential cheese parameters: to display date, batch number, cheese moisture, cost of ingredient per kilogram of cheese and cheese fat.
- Determine the dates (over the year) when the cheese yield is closest to 12%. Add a comment directed to a colleague regarding this specific yield value.
- Filter and display financial indicators when yield is below 10%: cost of ingredient per kilogram of cheese, ingredient cost/liter, cheese yield over time, and yield vs milk vat protein.
Report
- Include the different charts, titles, and share with collaborators.
- Add a title and introductory text.
- Insert the milk fat composition graph.
- Insert the milk protein composition graph.
- Add a table showing milk composition statistics.
- Insert the yield over time graph, along with a filtered version showing only data where yield is below 10%.
- Comment on the results.
- Share the report with a colleague — via email in the Excel and Word scenario, or using the built-in collaboration tools in nuVerve.
Data update
- Add the data from 2024 to previous 2023 data.
- Update all analysis and report content.
- Share the report with collaborators.
The same user with an average analytical background completed the tasks on both nuVerve and Excel/Word without automation or macros. The same hardware and user were used across both tools to ensure a fair comparison.
Materials
The same user with an average analytical background completed the tasks on both nuVerve and Excel/Word without automation or macros. The same hardware and user were used across both tools to ensure a fair comparison.
| Tool | Version |
|---|---|
| nuVerve | Web app (April 2025) |
| Excel | Microsoft® Excel® for Microsoft 365 (Version 2503) |
| Word | Microsoft® Word for Microsoft 365 (Version 2503) |
| Computer | Lenovo IdeaPad Slim 5, i7 processor, 16GB RAM, Windows 11. |
Results
To objectively compare nuVerve and the traditional Excel and Word workflow, we recorded the entire process for both environments. The following accelerated videos show the full execution of each task — from data exploration to report building and updates — with timers displayed for transparency.
Analysis & Report Creation
Watch how nuVerve completes the analysis and the report more than twice as fast as Excel and Word.
Updating with New Data
See how updating the analysis and report in nuVerve takes just a few minutes — over six times faster than the manual process.
Total Time Comparison
| Task | nuVerve Time | Excel+Word Time | Time saved | Speed Gain |
|---|---|---|---|---|
| Production of the Analysis and the Report | 18:56 | 43:34 | 24:38 | X2.3 |
| Update of the Analysis and the Report | 2:46 | 18:16 | 15:30 | X6.6 |
Using nuVerve, the production of the analysis and report was completed in under 19 minutes — 2.3 times faster than using Excel and Word.
The update process took less than 3 minutes with nuVerve, making it 6.6 times faster than the manual update in Excel and Word.
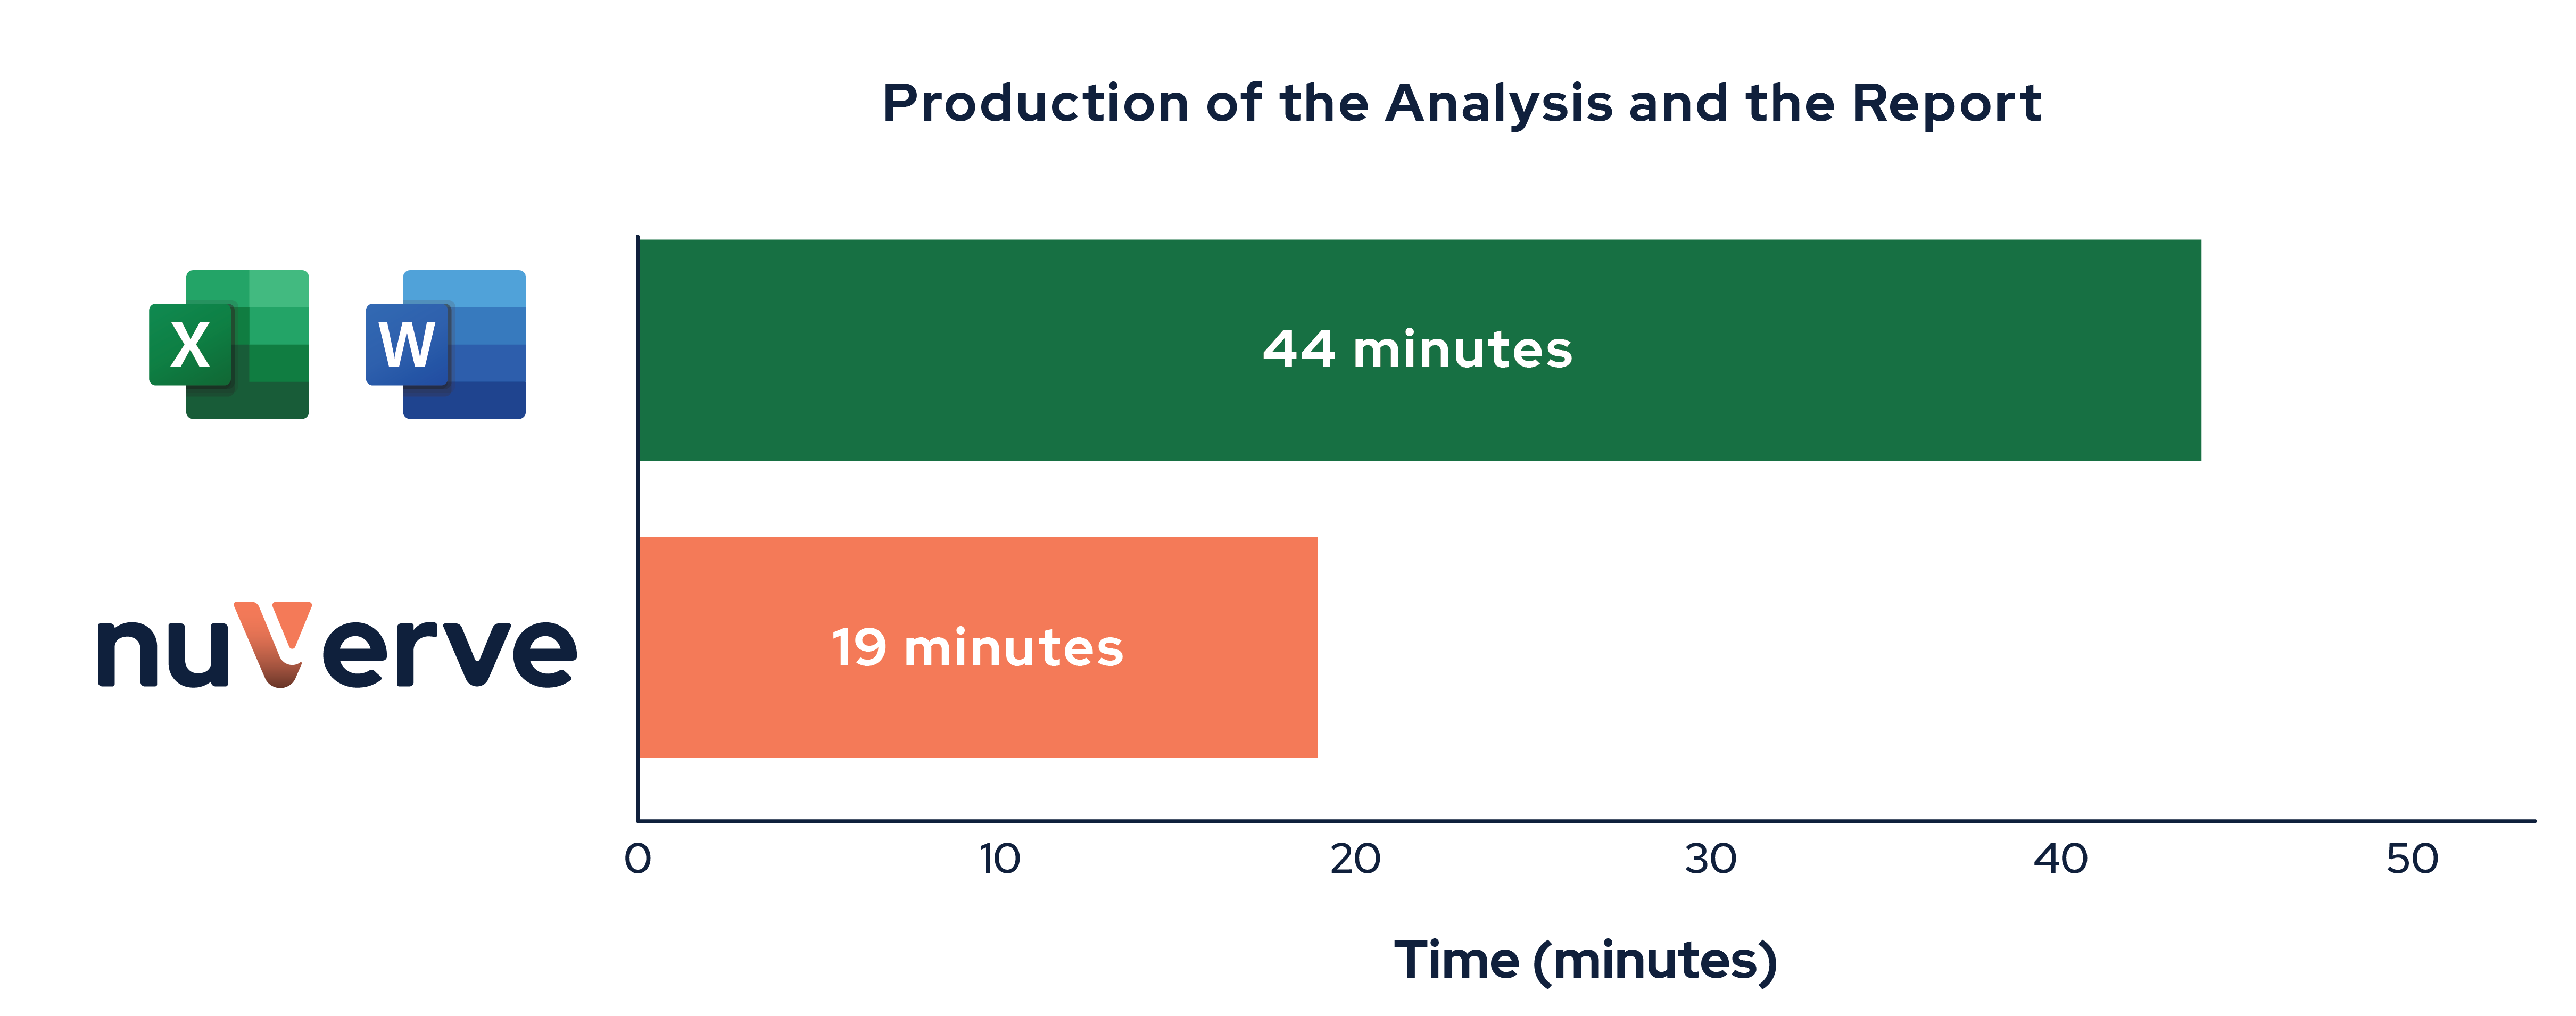
Figure 3: nuVerve is 2.3× faster for producing analysis and reports.

Figure 4: nuVerve is 6.6× faster for updating analysis and reports.
This demonstrates how nuVerve significantly streamlines both data exploration and routine updates of production data analysis as they are daily generated in the plant.
Financial Impact
To evaluate the cost-effectiveness of nuVerve, we modeled the typical schedule of a dairy production manager who updates and analyzes production data daily to inform decisions. We measured time savings based on the actual comparison results.
Methodology
- The production manager works daily with production data to maintain an up-to-date view of cheese and milk metrics.
- Tasks regarding data analysis include:
- Daily update of data and report: Each day, the production manager updates reports using the previous day’s data. The daily update takes 20 min using Excel and Word. In addition, the manager summarizes weekly performance once per week for another 20min using Excel and Word.
→ 5 days × 20 minutes + 20 minutes for weekly summary = 2 hours per week - Analysing trends and production drifts : The manager dives deep into the data to explore quality drivers, compares yields, analyses production drifts and prepares actions. The daily analysis takes 2 hours using Excel and Word
→ 5 days × 2 hours = 10 hours per week
- Daily update of data and report: Each day, the production manager updates reports using the previous day’s data. The daily update takes 20 min using Excel and Word. In addition, the manager summarizes weekly performance once per week for another 20min using Excel and Word.
- Production manager hourly rate : $50/hour
- Time savings using nuVerve
- Production of analysis and reporting: nuVerve is 2.3 times faster than Excel and Word.
- Update of analysis and reporting: nuVerve is 6.5 times faster than Excel and Word.
- nuVerve subscription: We assume a Team plan with one user, priced at $480 per year.
Annual Time and Labor Cost Comparison
This table compares the time investment and associated labor costs of managing production data using Excel & Word versus nuVerve.
The costs for nuVerve reflect only the time-based savings (at $50/hour) and do not include the nuVerve subscription, which is detailed in the next section.
| Excel & Word | nuVerve | |||||
|---|---|---|---|---|---|---|
| Task | Time per Week | Time per year | Yearly Cost | Time per Week | Time per year | Yearly Cost |
| Data updates and reporting | 2h | 104h | $5,200 | 0.3h | 16h | $800 |
| Data analysis | 10h | 520h | $26,000 | 4.3h | 226h | $11,300 |
| Total | 12h | 624h | $31,200 | 4.6h | 242h | $12,100 |
TOTAL SAVINGS WITH nuVerve
The table below summarizes the overall savings of switching from Excel and Word to nuVerve, taking into account both time and cost — including the nuVerve subscription.
| Without nuVerve | With nuVerve | Savings | |
|---|---|---|---|
| Monthly Time | 52h | 20h | 32h/month |
| Yearly Time | 624h | 242h | 382h/year |
| Yearly Cost | $31,200 | $12,100 in time + $480 subscription = $12,580 | $18,620/year |
Switching to nuVerve results in over 30 hours saved per month spent on routine updates and deep data investigation, and a reduction of more than $18,000 per year in labor and tool costs — for a single production manager.
This analysis does not account for other indirect but still significant benefits such as:
- Shared, easy and real-time access to production data across production, management and accounting teams.
- Reduced risk of human errors and data mishandling.
- Faster decision-making across departments to quickly restore production efficiency in case of deviations and to continuously improve production.
- Improved organization and navigation: while the Excel and Word workflow required 11 separate sheets to structure the analysis, nuVerve provides a centralized workspace with folders, projects, and intuitive navigation — making it easier to manage complex analyses and collaborate seamlessly.
Conclusion
This case study highlights how nuVerve can significantly accelerate the daily workflows of dairy industry professionals.
If your team relies on Excel and Word for data processing and reporting, nuVerve can save time, reduce risk, and deliver real ROI — from day one.
Key Results
Book a Call with our Dairy Data Experts